Ellis Richter · 6 September 2026
Mapping Visitor Movement Patterns Through Data at Seasonal Woodland Events
Seasonal woodland events draw crowds into forest environments where organizers track visitor flows using sensors and digital tools, and data collection starts with GPS-enabled wristbands alongside WiFi access points that log positions at regular intervals throughout the day. Researchers deploy these systems at multiple entry points and trail junctions so movement records accumulate into datasets that reveal preferred routes, dwell times at attractions, and peak congestion zones near food stalls or performance areas.
Data Collection Techniques in Forest Settings
Bluetooth beacons placed along marked paths transmit signals to visitor smartphones while thermal cameras mounted on trees capture crowd density without identifying individuals, and this combination allows analysts to cross-reference location stamps wth environmental factors such as slope gradients or canopy cover. Studies conducted at similar gatherings show that integration of weather station readings with movement logs highlights how rain events shift crowds toward covered structures, and the resulting heatmaps guide temporary signage adjustments that redirect foot traffic before bottlenecks form.
Event teams in North American parks have tested RFID tags embedded in reusable cups adn merchandise, which generates continuous data streams that feed into central dashboards updated every fifteen minutes. Observers note that these methods scale effectively when events span several days, and the raw logs undergo cleaning processes that remove duplicate entries before spatial analysis begins.
Analysis of Movement Patterns
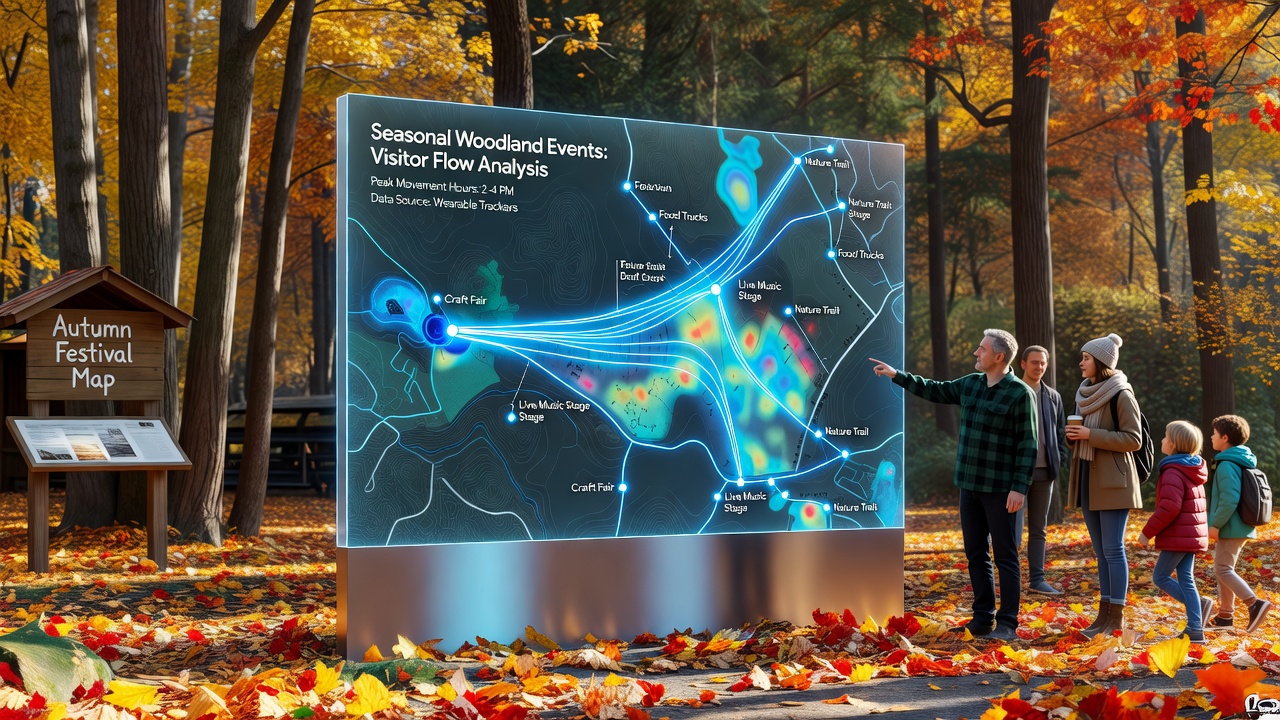
Geographic information system software processes the aggregated points into flow diagrams that illustrate primary circulation loops around central clearings, and researchers apply clustering algorithms to identify subgroups such as families who linger near interactive exhibits or solo visitors who favor perimeter trails. According to United States Forest Service reports on recreation site usage, these visualizations help planners predict how changes in vendor placement alter overall circulation speeds across the site.
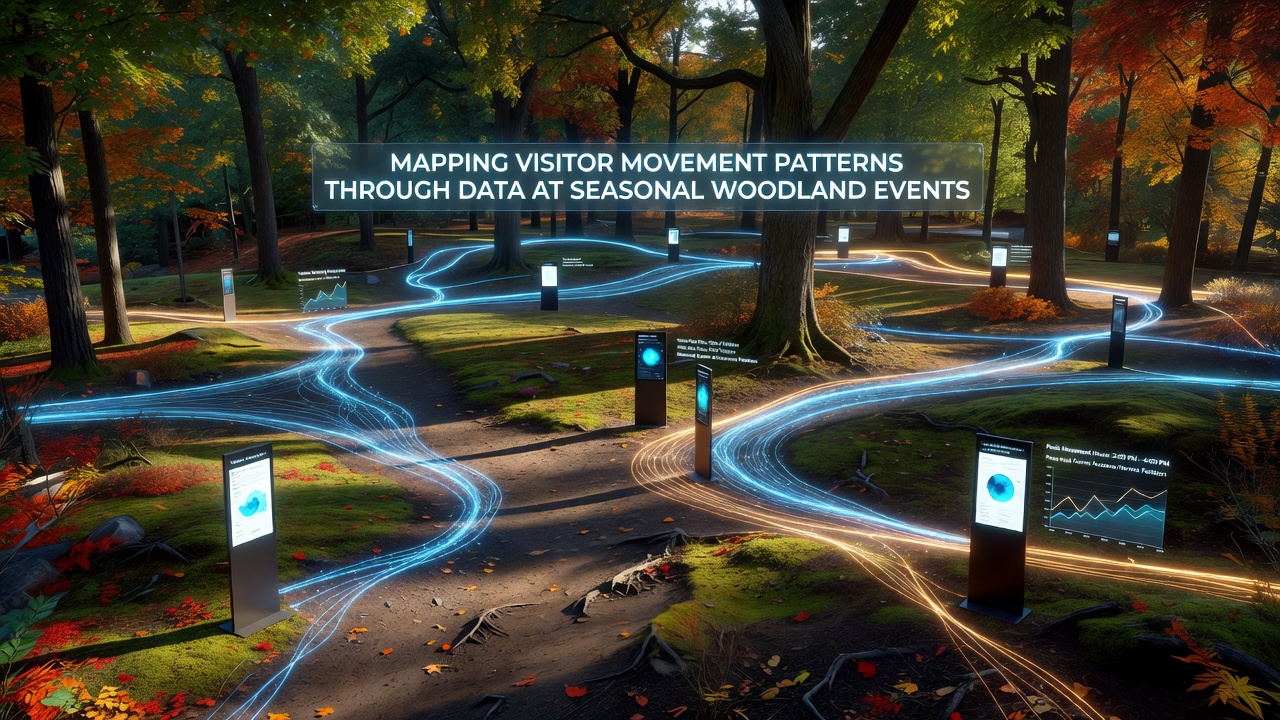
Further processing compares current season figures against historical baselines so organizers can measure the impact of new trail additions or expanded parking zones, and the same datasets support capacity modeling that estimates maximum safe attendance levels under varying weather scenarios. In September 2026 several woodland events plan to introduce drone-based photogrammetry that supplements ground sensors with overhead imagery updated hourly during peak hours.
Applications for Event Planning and Safety
Planners use the derived patterns to optimize emergency evacuation routes by simulating crowd dispersal from multiple starting locations, and simulation outputs inform placement of medical stations and security checkpoints at natural convergence points identified through the data. Industry analyses from the Canadian Institute for Health Information on public gathering safety indicate that preemptive adjustments based on movement modeling reduce response times during incidents.
Resource allocation benefits as well because restroom and waste collection schedules align with observed high-traffic periods rather than fixed timetables, and vendors receive guidance on inventory restocking drawn from dwell-time statistics near their stalls. Environmental monitoring teams correlate visitor density maps with soil compaction readings so protective matting can be deployed in advance along heavily used corridors.
Case Examples from Recent Seasons
One documented project at a multi-day forest gathering in the Pacific Northwest combined smartphone app check-ins with fixed camera counts and produced hourly density reports that organizers shared with local transport authorities to coordinate shuttle bus frequencies. Another initiative in European woodland venues integrated ticket-scanning timestamps with path sensors to quantify how staggered entry waves influenced downstream crowding, and the findings led to revised admission windows that flattened arrival peaks.
Academic researchers from institutions in Australia have published open datasets from comparable events that demonstrate how movement entropy metrics help quantify route diversity and predict fatigue-related slowdowns later in the day, and these resources allow smaller organizers to benchmark their own operations without starting from scratch.
Conclusion
Mapping visitor movement at seasonal woodland events relies on layered sensor networks and spatial analytics that convert raw location records into actionable insights for layout design, safety protocols, and resource distribution. Continued refinement of these techniques supports both operational efficiency and site preservation across successive seasons.